Application of stable isotope probing to identify temperature responsive bacterial taxa at the level of 3-hydroxy fatty acid synthesis
closed
collaboration
Authors
Affiliation
Olivier Rué
Migale bioinformatics facility
Christelle Hennequet-Antier
Migale bioinformatics facility
Published
November 22, 2023
Modified
November 30, 2024
Note
This document is a report of the analyses performed. You will find all the code used to analyze these data. The version of the tools (maybe in code chunks) and their references are indicated, for questions of reproducibility.
Aim of the project
The aim of the project is to provide a better understanding of how soil bacteria respond to temperature variations at the membrane level. Bacterial lipids can be used in paleoclimatology to reconstruct temperature of past climates in marine and terrestrial archives. This involves the use of proxies and calculations that are based on the relative amounts of these lipids. In soil, only one organic proxy is available, mainly due to the difficulty to work on soil, which is much more heterogeneous in structure than aquatic environments. A drawback of this sungle proxy is the error which is associated with it as well as the lack of confirmation of the result by a different approach. A new proxy based on 3-hydroxy fatty acids has been proposed in 2016. To better understand and validate this proxy, as well as to investigate new more precise proxies, we aim at understanding what soil bacterial species contribute to the proposed proxy by investigating their response te temperature at the taxonomic and lipid levels. We have used a DNA- and lipid-SIP approach during a time-course experiment and are now at the stage of analyzing what species have used the 13C labelled substrate in a temperature dependent manner. The profile of the enriched taxa in the 13C fraction will be compared in the different samples (different temperature, different incubation time) and will be compared with the 13C-enriched lipid profiles in the same samples.
Deliverables agreed at the preliminary meeting (Table 1).
Table 1: Deliverables
Definition
1
HTML report
Data management
Important
All data is managed by the migale facility for the duration of the project. Once the project is over, the Migale facility does not keep your data. We will provide you with the raw data and associated metadata that will be deposited on public repositories before the results are used. We can guide you in the submission process. We will then decide which files to keep, knowing that this report will also be provided to you and that the analyses can be replayed if needed.
Raw data
Raw data were sent on November 15 and deposited on the front server and a copy was sent to the abaca server.
Show the code
cd /home/orue/work/PROJECTS/TEMPO/mkdir RAW_DATA# Rename FASTQ filesfor i in DiversiteTEMPO/donneesbrutes/*_R1.fastq.gz ;doid=$(echo basename $i|cut-d'.'-f 5 );cp$i RAW_DATA/${id}.fastq.gz ;donefor i in DiversiteTEMPO/donneesbrutes/*_R2.fastq.gz ;doid=$(echo basename $i|cut-d'.'-f 5 );cp$i RAW_DATA/${id}.fastq.gz ;donescp-r RAW_DATA/ orue@abaca.maiage.inrae.fr:/backup/partage/migale/TEMPO/
Quality control
seqkit[1] was used to get informations from FASTQ files.
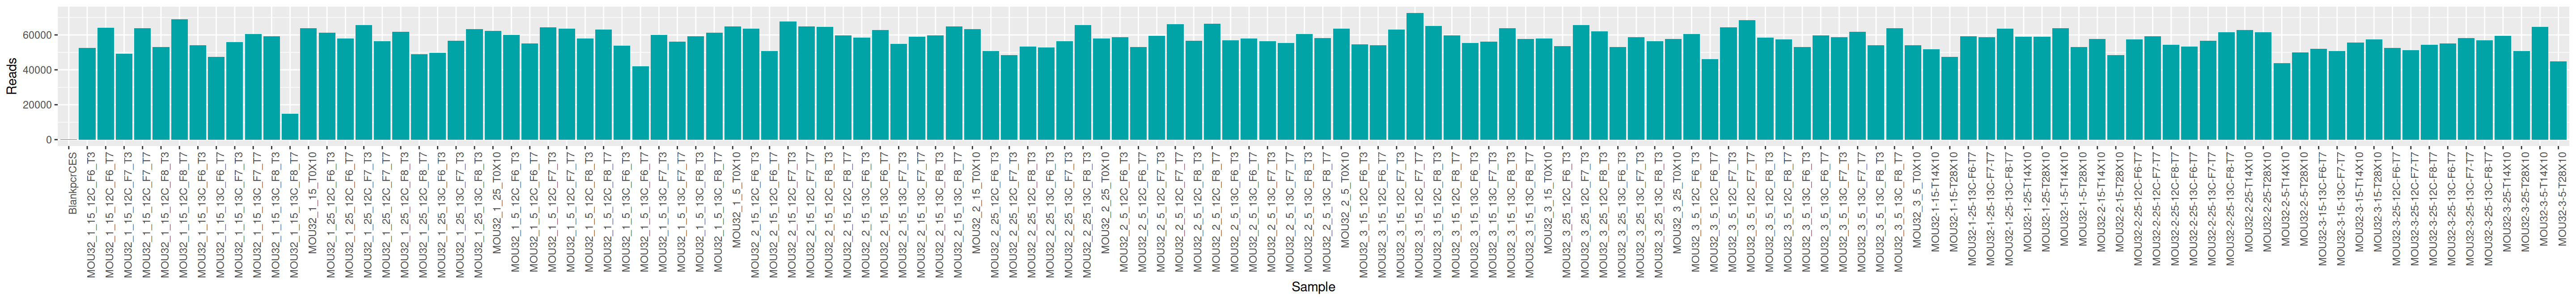
We can plot and display the number of reads to see if enough reads are present and if samples are homogeneous.
FastQC[2] is a program designed to spot potential problems in high througput sequencing datasets. It runs a set of analyses on one or more raw sequence files in fastq or bam format and produces a report which summarises the results. MultiQC[3] aggregates results from bioinformatics analyses across many samples into a single report.
The MultiQC report shows expected metrics for Illumina Miseq sequencing data.
Note
The quality control is good enough to go further. Only the PCR blank sample has too few reads. We will remove it later after having checked its composition.
Bioinformatics
We used FROGS[4], [5] to build amplicon sequence variants (ASVs) from raw reads.
The first tool, called preprocess allows to clean reads. From FASTQ files, we overlap R1 and R2 reads, then look at primers and remove them, filter on length and finally dereplicate remaining sequences.
The remove chimera report shows that 77.5% of the clusters (but 30% of the sequences) are considered as chimera. It is expected for 16S data.
Finally, we filter ASVs to remove low-abundant ASVs (composed of few sequences). We use the threshold of 0.005% of total abundance. We check also if phiX sequences are remaining.
The filters report is very informative. The filters have removed 99.6% of clusters. 1,901 ASVs are remaining. However, only 24.8% of the sequences were deleted. The smallest ASV is composed of 267 sequences. No phiX contamination is observed.
Now, it’s time to affiliate our ASVs to know what they are. We used blast[8] with Silva v.138.1[9].
The affiliation report shows that all ASVs have been affiliated. 17.6% of the ASVs are multi-affiliated at Species level. It means that the ASV sequences are shared with several species. It is expected for 16S sequences.
The affiliations stats report allows us to see the taxonomic compositon for each sample. An other interesting information is the alignment distribution. We show that the alignments are good (% identity and coverage). It indicates that our ASVs sequences were present in our databank.
Here are the informations of the ASVs:
Finally, we can build a phylogenetic tree from the sequences. It will allow us to use some diversity indices that need a phylogenetic tree.
3. Ewels P, Magnusson M, Lundin S, Käller M. MultiQC: Summarize analysis results for multiple tools and samples in a single report. Bioinformatics. 2016;32:3047–8.
4. Escudié F, Auer L, Bernard M, Mariadassou M, Cauquil L, Vidal K, et al. FROGS: Find, Rapidly, OTUs with Galaxy Solution. Bioinformatics. 2018;34:1287–94. doi:10.1093/bioinformatics/btx791.
5. Bernard M, Rué O, Mariadassou M, Pascal G. FROGS: a powerful tool to analyse the diversity of fungi with special management of internal transcribed spacers. Briefings in Bioinformatics. 2021;22. doi:10.1093/bib/bbab318.
6. Mahé F, Rognes T, Quince C, Vargas C de, Dunthorn M. Swarm v2: Highly-scalable and high-resolution amplicon clustering. PeerJ. 2015;3:e1420.
7. Rognes T, Flouri T, Nichols B, Quince C, Mahé F. VSEARCH: A versatile open source tool for metagenomics. PeerJ. 2016;4:e2584.
8. Altschul SF, Gish W, Miller W, Myers EW, Lipman DJ. Basic local alignment search tool. Journal of molecular biology. 1990;215:403–10.
9. Quast C, Pruesse E, Yilmaz P, Gerken J, Schweer T, Yarza P, et al. The SILVA ribosomal RNA gene database project: Improved data processing and web-based tools. Nucleic acids research. 2012;41:D590–6.
Reuse
This document will not be accessible without prior agreement of the partners
A work by Migale Bioinformatics Facility
Université Paris-Saclay, INRAE, MaIAGE, 78350, Jouy-en-Josas, France
Université Paris-Saclay, INRAE, BioinfOmics, MIGALE bioinformatics facility, 78350, Jouy-en-Josas, France
Source Code
---title: "TEMPO"search: falsenavbar: falsesubtitle: "Application of stable isotope probing to identify temperature responsive bacterial taxa at the level of 3-hydroxy fatty acid synthesis"author: - name: Olivier Rué orcid: 0000-0003-1689-0557 email: olivier.rue@inrae.fr affiliations: - name: Migale bioinformatics facility adress: Domaine de Vilvert city: Jouy-en-Josas state: France - name: Christelle Hennequet-Antier orcid: 0000-0001-5836-2803 email: christelle.hennequet-antier@inrae.fr affiliations: - name: Migale bioinformatics facility adress: Domaine de Vilvert city: Jouy-en-Josas state: Francedate: "2023-11-22"date-modified: "2024-11-30"categories: [closed, collaboration]image: "preview.jpg"reader-mode: falsefig-cap-location: bottomtbl-cap-location: toplicense: "This document will not be accessible without prior agreement of the partners"format: html: embed-resources: false toc: true toc-location: right page-layout: article code-fold: true code-summary: "Show the code" code-tools: true code-overflow: wraplightbox: auto---```{r setup, include=FALSE}knitr::opts_chunk$set(eval=TRUE, echo =TRUE, cache = FALSE, message = FALSE, warning = FALSE, cache.lazy = FALSE, fig.height = 3.5, fig.width = 10)``````{r load-packages, echo=FALSE, eval=TRUE, cache = FALSE}library(DT)library(scales)library(tidyverse)library(kableExtra)library(phyloseq)library(phyloseq.extended)library(data.table)library(InraeThemes)library(MicrobiotaProcess)library(metacoder) #visualization and annotation of phylogenetic treeslibrary(ggtree) #visualization and annotation of phylogenetic treeslibrary(ggtreeExtra) #visualization and annotation of phylogenetic treeslibrary(emmeans) #post hoc testslibrary(openxlsx) #save results to excel sheetslibrary(mia) # microbiome analysis with SummarizedExperiment and TreeSummarizedExperimentlibrary(ComplexHeatmap) # produce heatmaplibrary(viridis)``````{r datatable global options, echo=FALSE, eval=TRUE}options(DT.options = list(pageLength = 10, scrollX = TRUE, language = list(search = 'Filter:'), dom = 'lftipB', buttons = c('copy', 'csv', 'excel')))```{{< include /resources/_includes/_intro_note.qmd >}}# Aim of the projectThe aim of the project is to provide a better understanding of how soil bacteria respond to temperature variations at the membrane level. Bacterial lipids can be used in paleoclimatology to reconstruct temperature of past climates in marine and terrestrial archives. This involves the use of proxies and calculations that are based on the relative amounts of these lipids. In soil, only one organic proxy is available, mainly due to the difficulty to work on soil, which is much more heterogeneous in structure than aquatic environments. A drawback of this sungle proxy is the error which is associated with it as well as the lack of confirmation of the result by a different approach. A new proxy based on 3-hydroxy fatty acids has been proposed in 2016. To better understand and validate this proxy, as well as to investigate new more precise proxies, we aim at understanding what soil bacterial species contribute to the proposed proxy by investigating their response te temperature at the taxonomic and lipid levels. We have used a DNA- and lipid-SIP approach during a time-course experiment and are now at the stage of analyzing what species have used the 13C labelled substrate in a temperature dependent manner. The profile of the enriched taxa in the 13C fraction will be compared in the different samples (different temperature, different incubation time) and will be compared with the 13C-enriched lipid profiles in the same samples.## Partners* Olivier Rué - Migale bioinformatics facility - BioInfomics - INRAE* Christelle Hennequet-Antier - Migale bioinformatics facility - BioInfomics - INRAE* Sylvie Collin - Sorbonne Université## DeliverablesDeliverables agreed at the preliminary meeting (@tbl-deliverables).| | Definition ||------|------|| 1 | HTML report |: Deliverables {#tbl-deliverables}# Data management{{< include /resources/_includes/_data_management.qmd >}}## Raw dataRaw data were sent on November 15 and deposited on the `front server` and a copy was sent to the `abaca` server.```{bash, eval=F}cd /home/orue/work/PROJECTS/TEMPO/mkdir RAW_DATA# Rename FASTQ filesfor i in DiversiteTEMPO/donneesbrutes/*_R1.fastq.gz ; do id=$(echo basename $i |cut -d '.' -f 5 ) ;cp $i RAW_DATA/${id}.fastq.gz ; donefor i in DiversiteTEMPO/donneesbrutes/*_R2.fastq.gz ; do id=$(echo basename $i |cut -d '.' -f 5 ) ;cp $i RAW_DATA/${id}.fastq.gz ; donescp -r RAW_DATA/ orue@abaca.maiage.inrae.fr:/backup/partage/migale/TEMPO/```## Quality control{{< include /resources/_includes/_seqkit.qmd >}}```{bash, eval=FALSE}# seqkitcd /home/orue/work/PROJECTS/TEMPO/qsub -cwd -V -N seqkit -pe thread 4 -R y -b y "conda activate seqkit-2.0.0 && seqkit stats /home/orue/work/PROJECTS/TEMPO/RAW_DATA/*.fastq.gz -j 4 > raw_data.infos && conda deactivate"```We can plot and display the number of reads to see if enough reads are present and if samples are homogeneous.:::{.column-page}```{r, eval=T, echo=FALSE, fig.width=30}raw_data <- read.csv2("data/raw_data.infos", stringsAsFactors = F, sep="", strip.white=T, dec=".") %>% as_tibble() %>% mutate(sample = basename(gsub('.{12}$', '', file))) %>% distinct(sample, .keep_all = TRUE) %>% select(-file) %>% mutate(num_seqs = as.numeric(gsub(",", "", num_seqs))) %>% dplyr::rename(Sample = sample)p<-ggplot(data=raw_data, aes(x=raw_data$Sample, y=raw_data$num_seqs)) + xlab("Sample") + ylab("Reads") + scale_y_continuous() + geom_bar(stat="identity",fill=palette_inrae()[1]) + theme(axis.text.x = element_text(angle = 90, hjust = 1)) + scale_color_inrae() + geom_text(aes(y = raw_data$num_seqs, label = ""),position = position_stack(vjust = .5))p```:::```{r, echo=FALSE}raw_data %>% select(Sample, num_seqs, sum_len, min_len, avg_len, max_len) %>% datatable()```{{< include /resources/_includes/_fastqc_multiqc.qmd >}}```{bash, eval = FALSE}cd /home/orue/work/PROJECTS/TEMPO/mkdir FASTQC LOGSfor i in /home/orue/work/PROJECTS/TEMPO/RAW_DATA/*.fastq.gz ; do echo "conda activate fastqc-0.11.9 && fastqc $i -o FASTQC && conda deactivate" >> fastqc.sh ; doneqarray -cwd -V -N fastqc -o LOGS -e LOGS fastqc.shqsub -cwd -V -N multiqc -o LOGS -e LOGS -b y "conda activate multiqc-1.11 && multiqc FASTQC -o MULTIQC && conda deactivate"```The [MultiQC report](html/multiqc_report.html) shows expected metrics for Illumina Miseq sequencing data.::: callout-noteThe quality control is good enough to go further. Only the PCR blank sample has too few reads. We will remove it later after having checked its composition.:::# BioinformaticsWe used **FROGS** {{< iconify mdi tools >}} @frogs, @frogsITS to build amplicon sequence variants (ASVs) from raw reads.The first tool, called `preprocess` allows to clean reads. From FASTQ files, we overlap R1 and R2 reads, then look at primers and remove them, filter on length and finally dereplicate remaining sequences.```{bash, eval=FALSE}mkdir FROGS4cd FROGS4conda activate frogs-4.1.0preprocess.py illumina --merge-software pear --min-amplicon-size 250 --max-amplicon-size 580 --five-prim-primer CCTACGGGNGGCWGCAG --three-prim-primer GGATTAGATACCCBDGTAGTC --R1-size 300 --R2-size 300 --nb-cpus 16 --input-archive ../RAW_DATA/Tempo.tar.gz```The [preprocess report](html/preprocess.html) shows that almost all reads are kept (7,591,113 from 7,776,650), indicating that there were no problems during sequencing. Now we cluster sequences with **swarm** {{< iconify mdi tools >}} @swarm.```{bash, eval=FALSE}clustering.py --input-fasta preprocess.fasta --input-count preprocess_counts.tsv --nb-cpus 16 --distance 1 --fastidious```Then, we removed chimera with **vsearch** {{< iconify mdi tools >}} @vsearch.```{bash, eval=FALSE}remove_chimera.py --input-fasta clustering.fasta --input-biom clustering.biom --non-chimera remove_chimera.fasta --nb-cpus 8 --log-file remove_chimera.log --out-abundance remove_chimera.biom --summary remove_chimera.html```The [remove chimera report](html/remove_chimera.html) shows that 77.5% of the clusters (but 30% of the sequences) are considered as chimera. It is expected for 16S data.Finally, we filter ASVs to remove low-abundant ASVs (composed of few sequences). We use the threshold of 0.005% of total abundance. We check also if _phiX_ sequences are remaining.```{bash, eval=FALSE}cluster_filters.py --input-fasta remove_chimera.fasta --input-biom remove_chimera_abundance.biom --output-fasta filters.fasta --nb-cpus 8 --log-file filters.log --output-biom filters.biom --summary filters.html --excluded filters_excluded.tsv --contaminant /db/outils/FROGS/contaminants/phi.fa --min-sample-presence 1 --min-abundance 0.00005```The [filters report](html/filters.html) is very informative. The filters have removed 99.6% of clusters. 1,901 ASVs are remaining. However, only 24.8% of the sequences were deleted. The smallest ASV is composed of 267 sequences. No phiX contamination is observed.Now, it's time to affiliate our ASVs to know what they are. We used **blast** {{< iconify mdi tools >}} @blast with **Silva v.138.1** {{< iconify mdi database >}} @silva.```{bash, eval=FALSE}taxonomic_affiliation.py --reference /db/outils/FROGS/assignation/silva_138.1_16S_pintail100/silva_138.1_16S_pintail100.fasta --input-biom filters.biom --input-fasta filters.fasta --output-biom affiliation.biom --nb-cpus 8 --taxonomy-ranks 'Domain', 'Phylum', 'Class', 'Order', 'Family', 'Genus', 'Species'```The [affiliation report](html/taxonomic_affiliation.html) shows that all ASVs have been affiliated. 17.6% of the ASVs are multi-affiliated at Species level. It means that the ASV sequences are shared with several species. It is expected for 16S sequences.The [affiliations stats report](html/affiliations_stats.html) allows us to see the taxonomic compositon for each sample. An other interesting information is the alignment distribution. We show that the alignments are good (% identity and coverage). It indicates that our ASVs sequences were present in our databank.Here are the informations of the ASVs:```{r, echo=FALSE, eval=TRUE}read.csv2("html/affiliation.tsv", sep="\t") %>% datatable()```Finally, we can build a phylogenetic tree from the sequences. It will allow us to use some diversity indices that need a phylogenetic tree.```{bash, eval=F}ree.py --biom-file affiliation.biom --input-sequences filters.fasta --out-tree tree.nwk --log-file tree.log --html tree.html```Here is the [tree report](html/tree.html).```{bash, eval=FALSE, echo=FALSE}25200 2024-02-07 08:37:55 cp filters.html ~/save/web/25201 2024-02-07 08:39:35 cluster_stats.py --input-biom filters.biom -o clusters_stat_filters.html25202 2024-02-07 08:39:54 cp clusters_stat_filters.html ~/save/web/25203 2024-02-07 08:41:18 taxonomic_affiliation.py --reference /db/outils/FROGS/assignation/silva_138.1_16S_pintail100/silva_138.1_16S_pintail100.fasta --input-biom filters.biom --input-fasta filters.fasta --output-biom affiliation.biom --nb-cpus 8 --taxonomy-ranks 'Domain', 'Phylum', 'Class', 'Order', 'Family', 'Genus', 'Species'25204 2024-02-07 09:14:48 biom_to_tsv.py --input-biom affiliation.biom --output-tsv affiliation.tsv --input-fasta filters.fasta25205 2024-02-07 09:15:16 tree.py --biom-file affiliation.biom --input-sequences filters.fasta --out-tree tree.nwk --log-file tree.log --html tree.htmlmkdir FROGS5cd FROGS5conda activate frogs-4.1.0conda_lib_dir=`echo $(dirname $(dirname $(which preprocess.py)))/libexec`export PATH=$conda_lib_dir:$PATHexport PATH="/home/orue/work/GIT/FROGS2023OK/libexec":$PATHexport PATH="/home/orue/work/GIT/FROGS2023OK/app":$PATHexport PYTHONPATH=`echo $(dirname $(dirname $(which preprocess.py)))/lib`:$PYTHONPATHdenoising.py illumina --merge-software pear --process dada2 --min-amplicon-size 250 --max-amplicon-size 580 --five-prim-primer CCTACGGGNGGCWGCAG --three-prim-primer GGATTAGATACCCBDGTAGTC --R1-size 300 --R2-size 300 --nb-cpus 16 --input-archive ../RAW_DATA/Tempo.tar.gz --output-biom denoising.biom --output-fasta denoising.fasta --summary denoising.html --log-file denoising.log --debug --sample-inference pseudo-pooling```# Biostatistics## Diversity Analyses with all samples```{r}#| label: diversity_all#| include: falsescript_name <-paste("1_Diversity_", "All",".qmd", sep='')file.copy(from =file.path("./script",script_name), to =file.path("./html",script_name), overwrite =TRUE)quarto::quarto_render(input =file.path("html",script_name),execute_dir ="./html/",cache_refresh =TRUE,use_freezer =FALSE )```## Diversity Analyses with Time T0-T14-T28 samples```{r}#| label: diversity_T0-T14-T28#| include: falsescript_name <-paste("1_Diversity_Time-T0-T14-T28",".qmd", sep='')file.copy(from =file.path("./script",script_name), to =file.path("./html",script_name), overwrite =TRUE)quarto::quarto_render(input =file.path("html",script_name),execute_dir ="./html/",cache_refresh =TRUE,use_freezer =FALSE )```## Diversity Analyses with Time T3-T7 samples```{r}#| label: diversity_T3-T7#| include: falsescript_name <-paste("1_Diversity_Time-T3-T7",".qmd", sep='')file.copy(from =file.path("./script",script_name), to =file.path("./html",script_name), overwrite =TRUE)quarto::quarto_render(input =file.path("html",script_name),execute_dir ="./html/",cache_refresh =TRUE,use_freezer =FALSE )```Reports on diversity analyses for each phyloseq object* [ALL](./html/1_Diversity_All.html)* [Time-T0-T14-T28](./html/1_Diversity_Time-T0-T14-T28.html)* [Time-T3-T7](./html/1_Diversity_Time-T3-T7.html)# Reproducibility token```{r}sessioninfo::session_info(pkgs ="attached")```