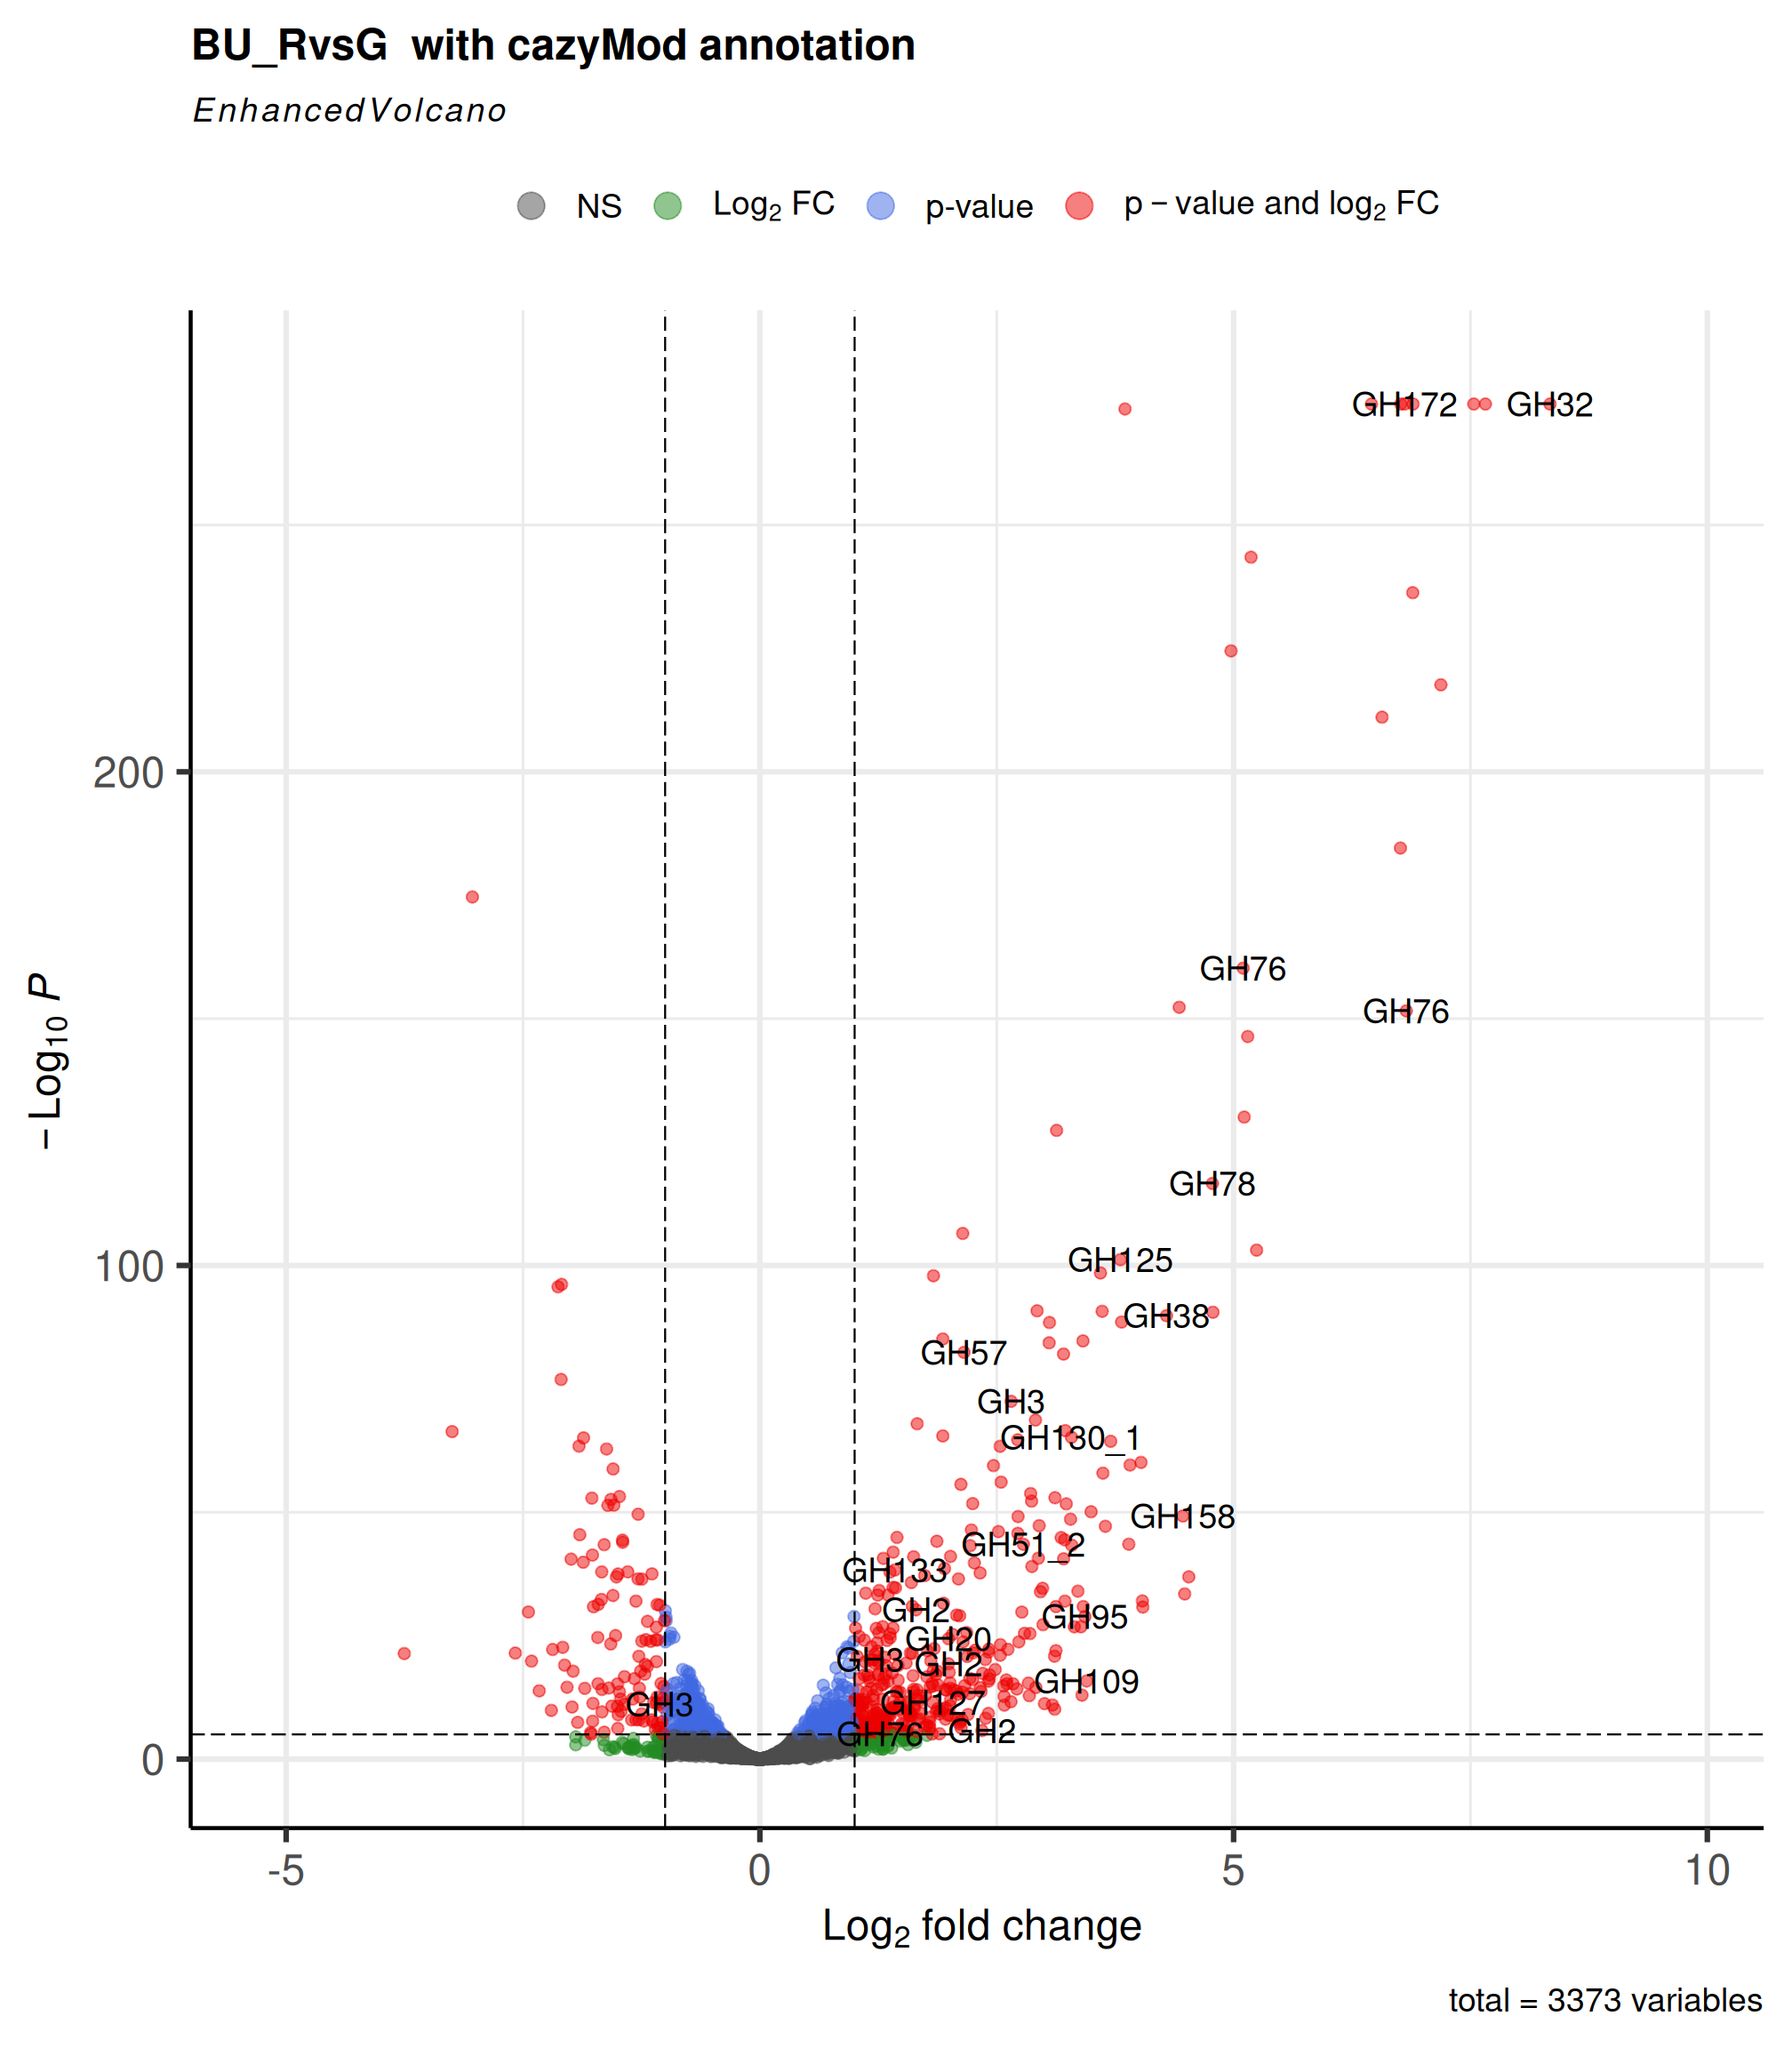
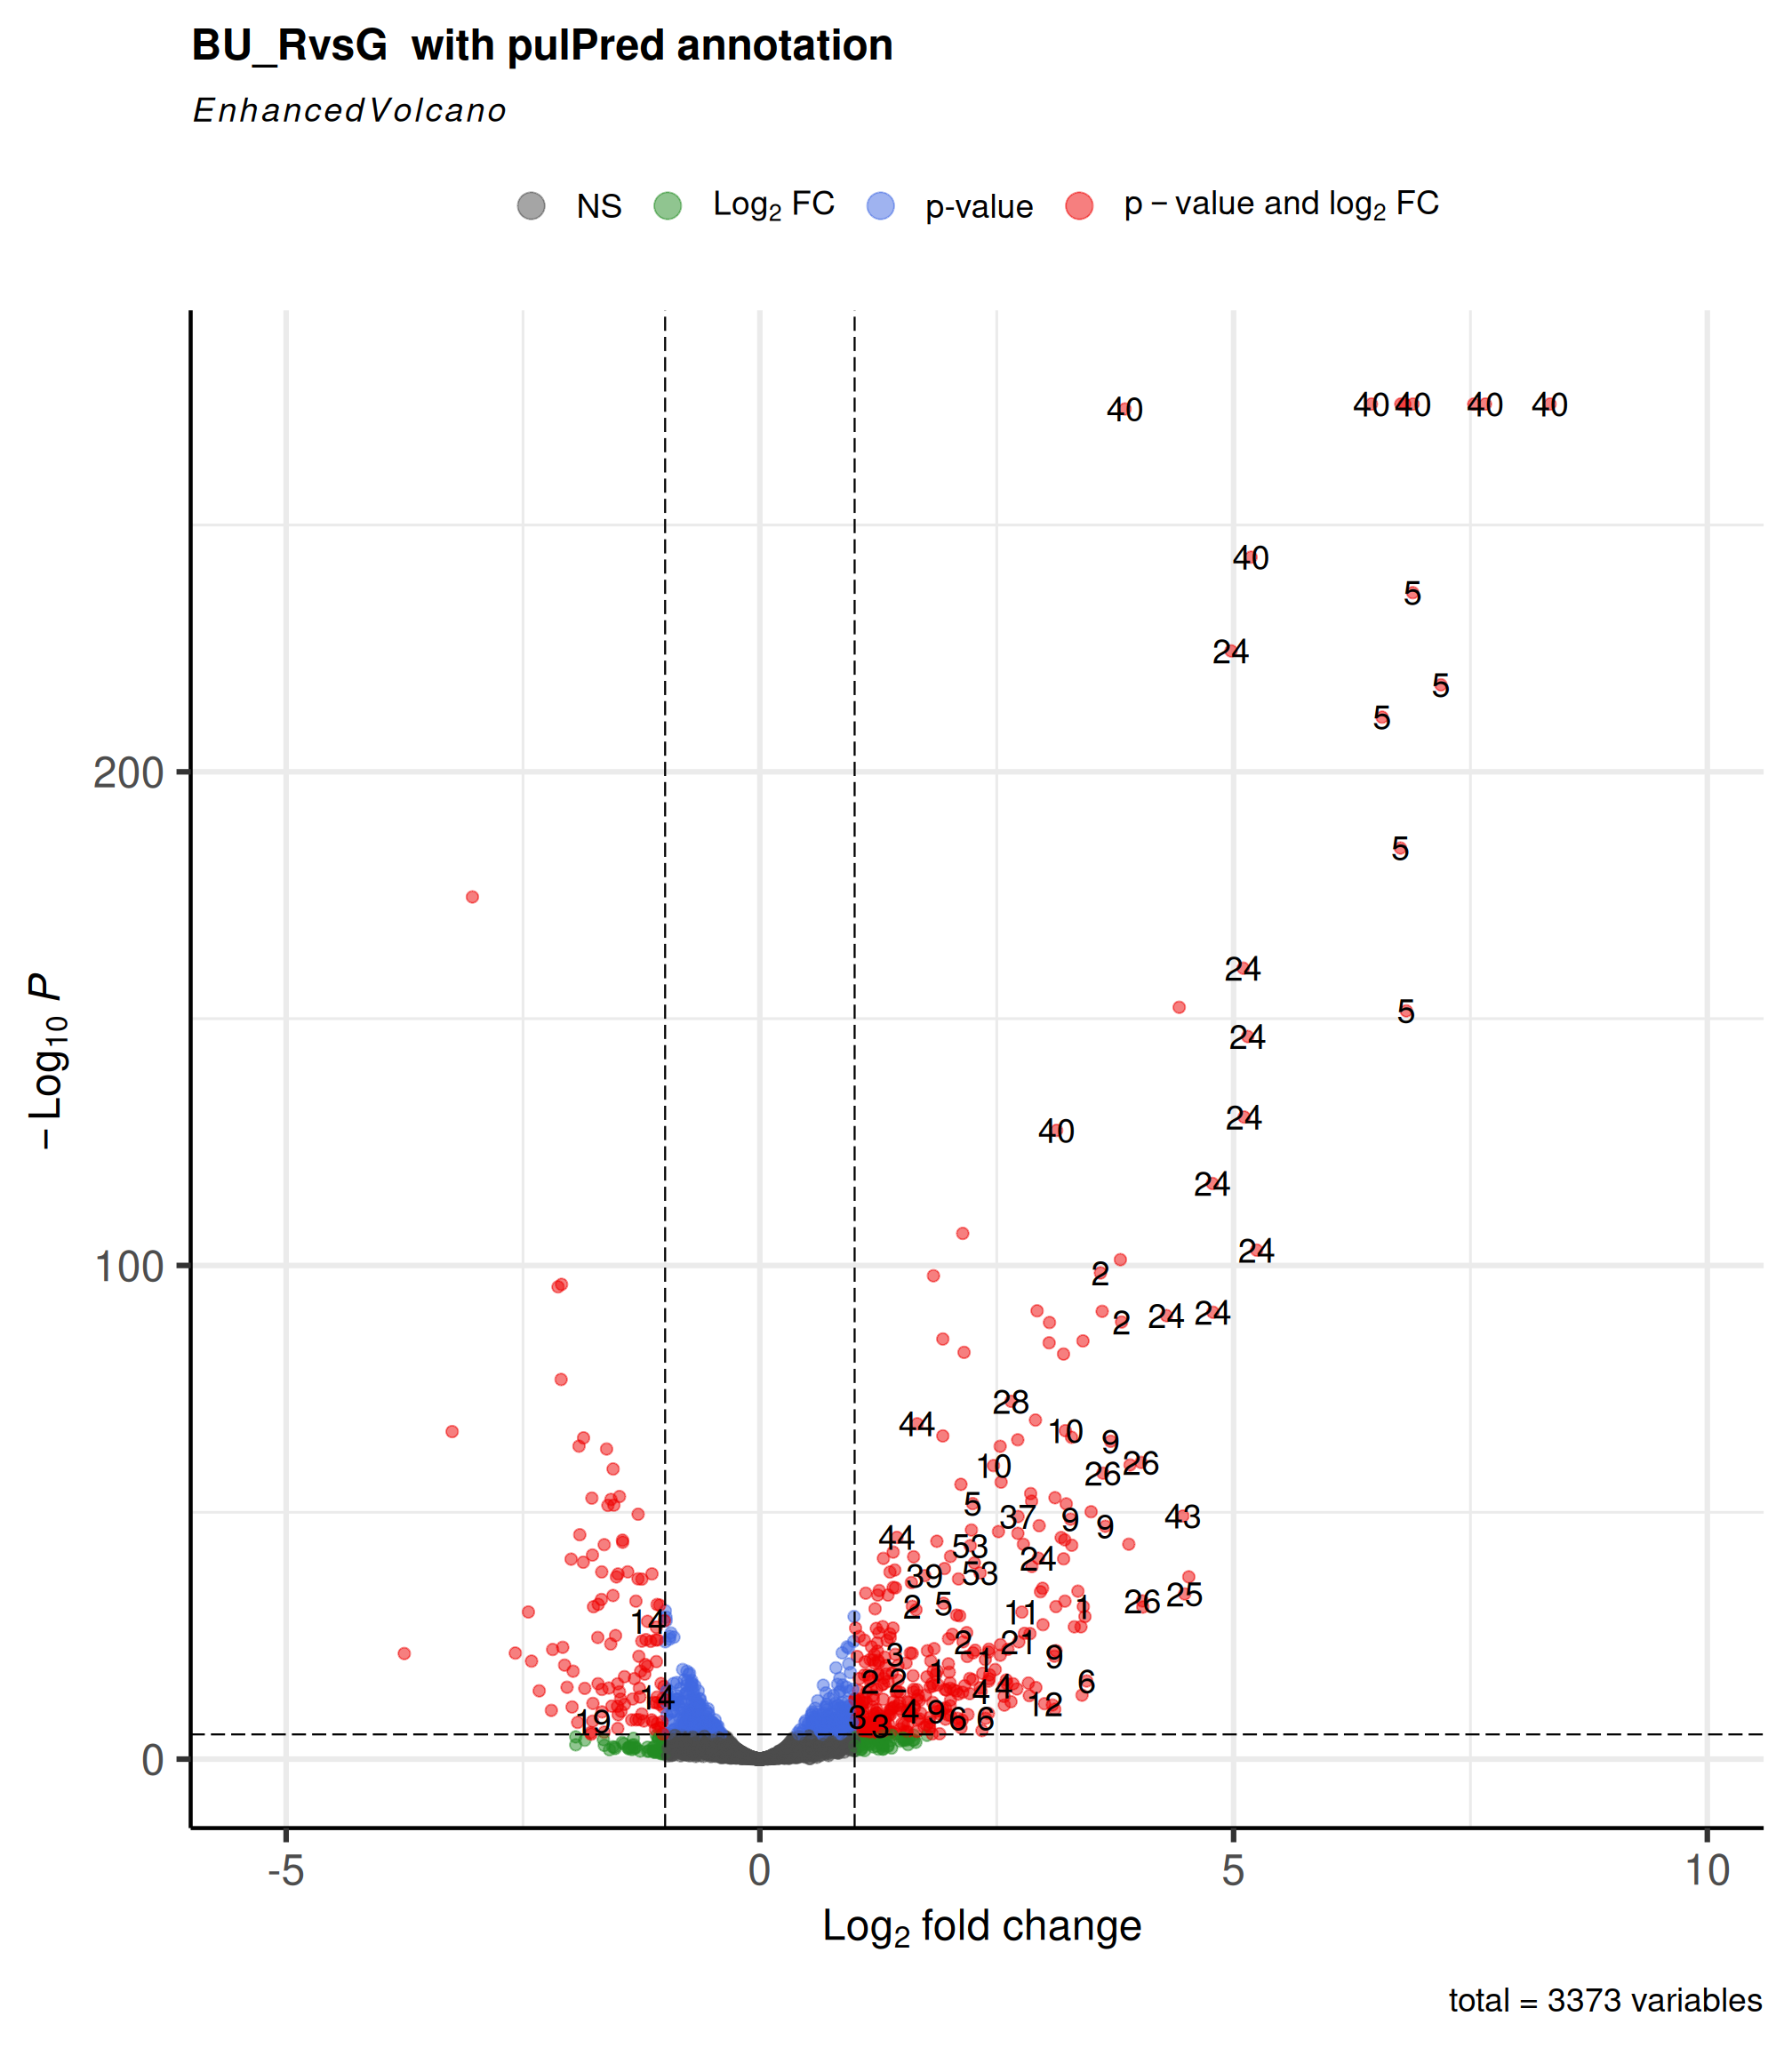
Volcano plots represent a useful way to visualise the results of differential expression analyses. The x-axis is log2 fold change and represents biological significance. The y-axis is -Log10 (adjusted Pvalue) of the contrast tested and represents statistical significance. The highest genes on the graph are the most significantly differentially expressed (DE) genes.
Volcano plots were performed with EnhancedVolcano R package.
Here Volcano plot with annotation given by cazyMod and pulPredcolumns if available.
Show the code
if (nameEXP =="BU") {for( ctr in1:length(my.files)){ res <-read.xlsx(xlsxFile =paste0("../html/",my.files[ctr]), sheet =1) my.title <- my.files[ctr] %>%str_remove(., ".xlsx")# p1 <- EnhancedVolcano(res,# lab = res$Gene_ID,# labSize = 0.0, # if zero then no label# x = 'log2FoldChange',# y = 'padj',# FCcutoff = 1,# title = my.title)# print(p1) p3 <-EnhancedVolcano(res,lab = res$cazyMod,x ='log2FoldChange',y ='padj',FCcutoff =1,title =paste(my.title, " with cazyMod annotation"))print(p3) p4 <-EnhancedVolcano(res,lab = res$pulPred,x ='log2FoldChange',y ='padj',FCcutoff =1,title =paste(my.title, " with pulPred annotation"))print(p4) # table of cazy genes pul <- res %>%filter(!is.na(pulPred)) cazy <- res %>%filter(!is.na(cazyMod))# using openxlsx package to export results excelsheets <-list(complete = res, pul = pul, cazy = cazy) write.xlsx(excelsheets, file =paste0("../html/", my.title,"_cazy_pul.xlsx"))} # End for } else {for( ctr in1:length(my.files)){ res <-read.xlsx(xlsxFile =paste0("../html/",my.files[ctr]), sheet =1) my.title <- my.files[ctr] %>%str_remove(., ".xlsx")# p1 <- EnhancedVolcano(res,# lab = res$Gene_ID,# labSize = 0.0, # if zero then no label# x = 'log2FoldChange',# y = 'padj',# FCcutoff = 1,# title = my.title)# print(p1) p3 <-EnhancedVolcano(res,lab = res$cazyMod,x ='log2FoldChange',y ='padj',FCcutoff =1,title =paste(my.title, " with cazyMod annotation"))print(p3)# table of cazy genes# pul <- res %>% filter(! is.na(pulPred)) cazy <- res %>%filter(!is.na(cazyMod))# using openxlsx package to export results excelsheets <-list(complete = res, # pul = pul, cazy = cazy) write.xlsx(excelsheets, file =paste0("../html/", my.title,"_cazy.xlsx")) } # End for } # End else
This document will not be accessible without prior agreement of the partners
A work by Migale Bioinformatics Facility
Université Paris-Saclay, INRAE, MaIAGE, 78350, Jouy-en-Josas, France
Université Paris-Saclay, INRAE, BioinfOmics, MIGALE bioinformatics facility, 78350, Jouy-en-Josas, France
Source Code
---params: my.interest: "BU"title: "RESTORBIOME2: Volcano plot"subtitle: "Experiment with `r params$my.interest`"author: - name: Olivier Rué orcid: 0000-0003-1689-0557 email: olivier.rue@inrae.fr affiliations: - name: Migale bioinformatics facility adress: Domaine de Vilvert city: Jouy-en-Josas state: France - name: Christelle Hennequet-Antier orcid: 0000-0001-5836-2803 email: christelle.hennequet-antier@inrae.fr affiliations: - name: Migale bioinformatics facility adress: Domaine de Vilvert city: Jouy-en-Josas state: Francedate: "2023-05-02"date-modified: today#bibliography: ../../../resources/biblio.bib # don't change#csl: ../../../resources/biomed-central.csl # don't change# # Do not modify this section without taking precautions# # Don't remove the commented line, it is usefull for building the site with this new project!license: "This document will not be accessible without prior agreement of the partners"format: html: embed-resources: false toc: true toc-location: right page-layout: article code-overflow: wrap code-fold: true code-tools: true code-summary: "Show the code"---```{r}#| label = "setup",#| include = FALSEknitr::opts_chunk$set(echo =TRUE, cache =FALSE, message =FALSE, warning =FALSE, fig.height =3.5, fig.width =10.5)``````{r}#| label = "setuplib"#Use packages and functions#Use packages and functionslibrary(ExperimentSubset)library(dplyr)library(purrr)library(stringr)library(EnhancedVolcano)library(RColorBrewer)library(colorspace)library(openxlsx) # manipulation excel files```We used results from differential analysis performed on `r params$my.interest` experiment using **edgeR** {{< iconify mdi tools >}} R package.```{r}#| label = "Files"nameEXP <- params$my.interestmy.files <-list.files(path ="../html") %>%str_subset(., "G.xlsx$") %>%str_subset(., params$my.interest)# load DE results# cat("Experiment ", params$my.interest)```# Volcano plotsVolcano plots represent a useful way to visualise the results of differential expression analyses. The x-axis is log2 fold change and represents biological significance. The y-axis is -Log10 (adjusted Pvalue) of the contrast tested and represents statistical significance. The highest genes on the graph are the most significantly differentially expressed (DE) genes.Volcano plots were performed with **EnhancedVolcano** {{< iconify mdi tools >}} R package.<!-- Here Volcano plot with annotation given by `pulPred` and `cazyMod` columns if available. -->Here Volcano plot with annotation given by `cazyMod` and `pulPred`columns if available.```{r}#| label = "Volcano",#| fig.height = 12,#| fig.width = 10.5if (nameEXP =="BU") {for( ctr in1:length(my.files)){ res <-read.xlsx(xlsxFile =paste0("../html/",my.files[ctr]), sheet =1) my.title <- my.files[ctr] %>%str_remove(., ".xlsx")# p1 <- EnhancedVolcano(res,# lab = res$Gene_ID,# labSize = 0.0, # if zero then no label# x = 'log2FoldChange',# y = 'padj',# FCcutoff = 1,# title = my.title)# print(p1) p3 <-EnhancedVolcano(res,lab = res$cazyMod,x ='log2FoldChange',y ='padj',FCcutoff =1,title =paste(my.title, " with cazyMod annotation"))print(p3) p4 <-EnhancedVolcano(res,lab = res$pulPred,x ='log2FoldChange',y ='padj',FCcutoff =1,title =paste(my.title, " with pulPred annotation"))print(p4) # table of cazy genes pul <- res %>%filter(!is.na(pulPred)) cazy <- res %>%filter(!is.na(cazyMod))# using openxlsx package to export results excelsheets <-list(complete = res, pul = pul, cazy = cazy) write.xlsx(excelsheets, file =paste0("../html/", my.title,"_cazy_pul.xlsx"))} # End for } else {for( ctr in1:length(my.files)){ res <-read.xlsx(xlsxFile =paste0("../html/",my.files[ctr]), sheet =1) my.title <- my.files[ctr] %>%str_remove(., ".xlsx")# p1 <- EnhancedVolcano(res,# lab = res$Gene_ID,# labSize = 0.0, # if zero then no label# x = 'log2FoldChange',# y = 'padj',# FCcutoff = 1,# title = my.title)# print(p1) p3 <-EnhancedVolcano(res,lab = res$cazyMod,x ='log2FoldChange',y ='padj',FCcutoff =1,title =paste(my.title, " with cazyMod annotation"))print(p3)# table of cazy genes# pul <- res %>% filter(! is.na(pulPred)) cazy <- res %>%filter(!is.na(cazyMod))# using openxlsx package to export results excelsheets <-list(complete = res, # pul = pul, cazy = cazy) write.xlsx(excelsheets, file =paste0("../html/", my.title,"_cazy.xlsx")) } # End for } # End else```# Reproducibility token```{r}#| label = "sessionInfo"sessioninfo::session_info(pkgs ="attached")```# References